SUNGRAPH CALANDER
dcgeorge.com
The personal website of Douglas C. George.
|
SUNGRAPH CALANDER |
dcgeorge.com |
The personal website of Douglas C. George. |
|
|
|
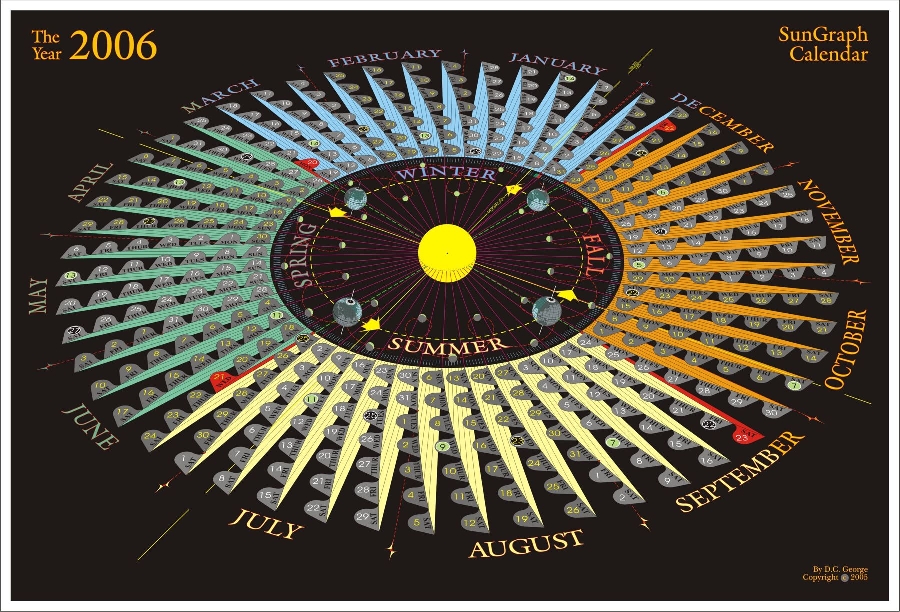
The SunGraph Calendar combines artistic fantasy with the precision mathematics of astronomical science to show a true-to-life snapshot of the entire calendar year. The SunGraph accurately illustrates the correspondence between the calendar dates for the year and the daily position of the Earth as it falls through its trajectory around the sun. It also clearly portrays the relationship between the seasons and the tilt of the Earth's axis. The SunGraph is the calendar that shows it like it is. Click here for a Large Image of the SunGraph (953 KB)
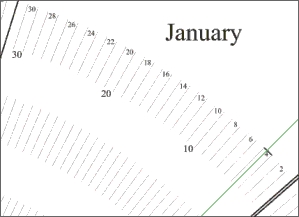
The SunGraph Calendar is built on a computer-generated radial grid that allots a thin wedge of space to each day of the year. The grid calculations use an astronomical formula that is correct within one arc second (one 3600th of one degree). Earth's orbit is very close to being a perfect circle but it's not quite perfect. For this reason, the planet gains speed as it draws closer to the sun and slows again as it moves away. The computer program takes this into account and makes each wedge slightly different in width corresponding precisely to the way the Earth's speed changes as it falls through its orbit. Click here for a large Image of Grid (271 KB)
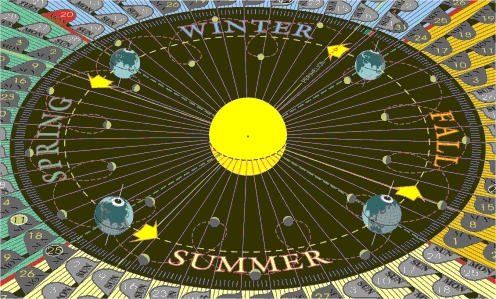
The calendar is oriented as a "cross-quarter" view, which puts the mid-point of the winter season at the top of the page. This viewing angle was chosen to better show the tilt of the Earth's spin-axis.
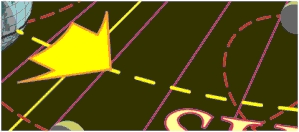
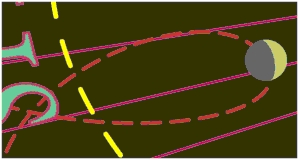
The Earth's orbit (dashed yellow line) is slightly elliptical with the sun located near one focus of the ellipse. Because of the drawing perspective, the orbit appears more elliptical than it actually is.
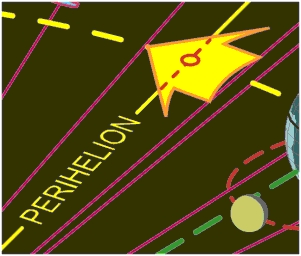
The point of the orbit closest to the sun, called perihelion, lies on the major axis of the ellipse. Perihelion is denoted on the calendar by a small red circle at the point where the orbital path crosses the major axis.
The Four seasons are caused by the 23.4 degree tilt of the Earth's spin-axis relative to the plane of the orbit. The solstices and equinoxes each mark the beginning of a season. The days on which these events occur are shown in red. The summer solstice (shown above) occurs when the sun reaches its highest point in the sky for the year. The winter solstice occurs when the sun is at its lowest point for the year. The equinoxes are the two days of the year when day and night are of equal duration. Each of these special days has an accompanying image of the Earth which shows the Earth's orientation and the Earth's shadow at the hour of that particular equinox or solstice.
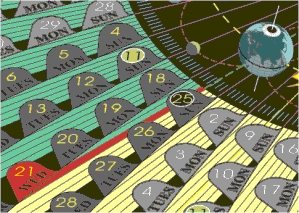
The small blue hatch marks just outside the ring of full moons show the Earth's position at the beginning of each day.
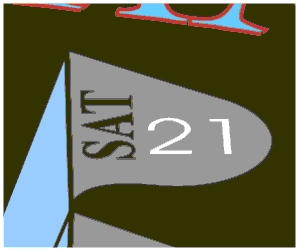
The date tab attached to each grid space shows the day of the week, the day of the month and when each day begins and ends. The date tab for each full moon has the date inside a yellow circle. The date tab for each new moon has the date inside a black circle
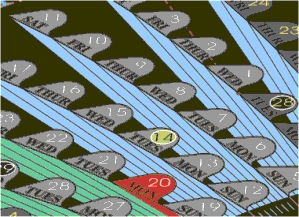
The seven days comprising each week are grouped together in a wing-shaped structure colored according to the particular season. The red lines radiating from the sun mark the start of each week.
The looping path of the moon is indicated and each full moon and each new moon is shown in its correct position.
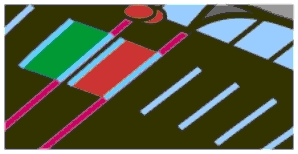
Most calendars in use today represent a normal year (a non leap year) as 365 days but a year is really about 365 1/4 days. This discrepancy shows up on the SunGraph as a 1/4 day gap following the last day of the year. To help the viewer see this, the area between the small blue hatch marks for the first day of the year is filled with green and that for the last day of the year is filled with red. The 1/4 day gap lies between these two colored divisions. Every leap year, a day is added to the calendar to make up for the accumulated discrepancy.
In order to show details that would otherwise be too small to be seen, artistic license has been exercised with regard to relative sizes of objects and the distances between them.